 5-minute briefs
What Is CPI? Why the Consumer Price Index Moves Markets
#CPI#inflation#rate hike#economic indicators
CPI at a glance
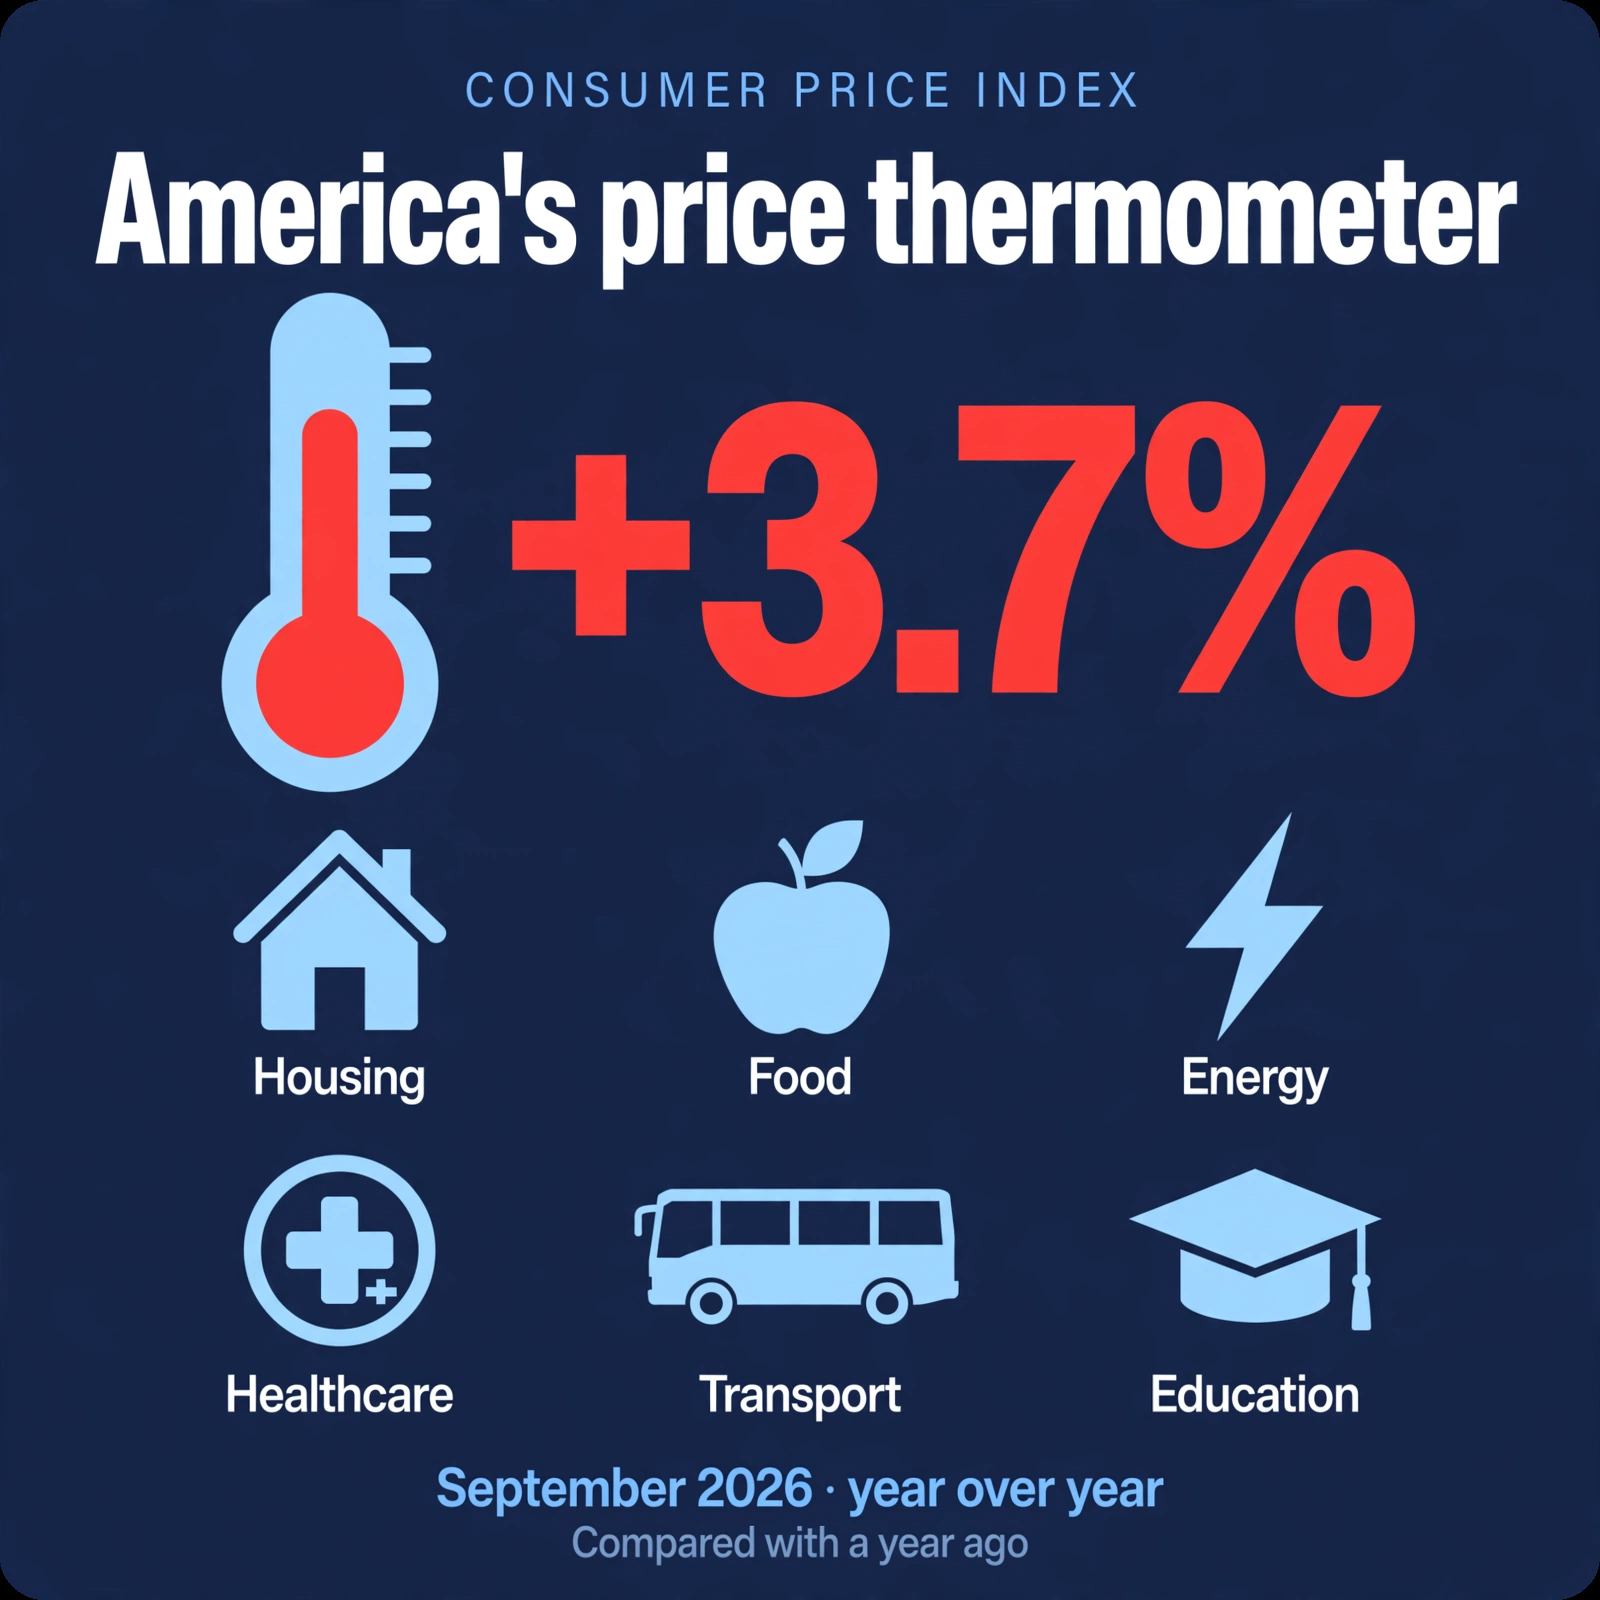
CPI stands for Consumer Price Index. It is America’s headline inflation gauge, published monthly by the Bureau of Labor Statistics (BLS), part of the U.S. Department of Labor.
The method is simple. Take a basket of what American households actually buy — housing, food, energy, healthcare, transportation, and education — and measure how its price changed versus a year ago. If the basket cost 100 a year ago and 103.7 now, CPI inflation is +3.7%. BLS field economists collect the prices each month by surveying stores and households across the country. The sample is designed to represent the spending of all U.S. urban households.
Why does it matter? The Fed’s official target is 2% PCE inflation — CPI isn’t the target itself, but it’s the earliest inflation signal each month. When CPI runs hot, it signals the Fed may raise rates — which is why investors worldwide watch each monthly release.
Headline vs. core CPI
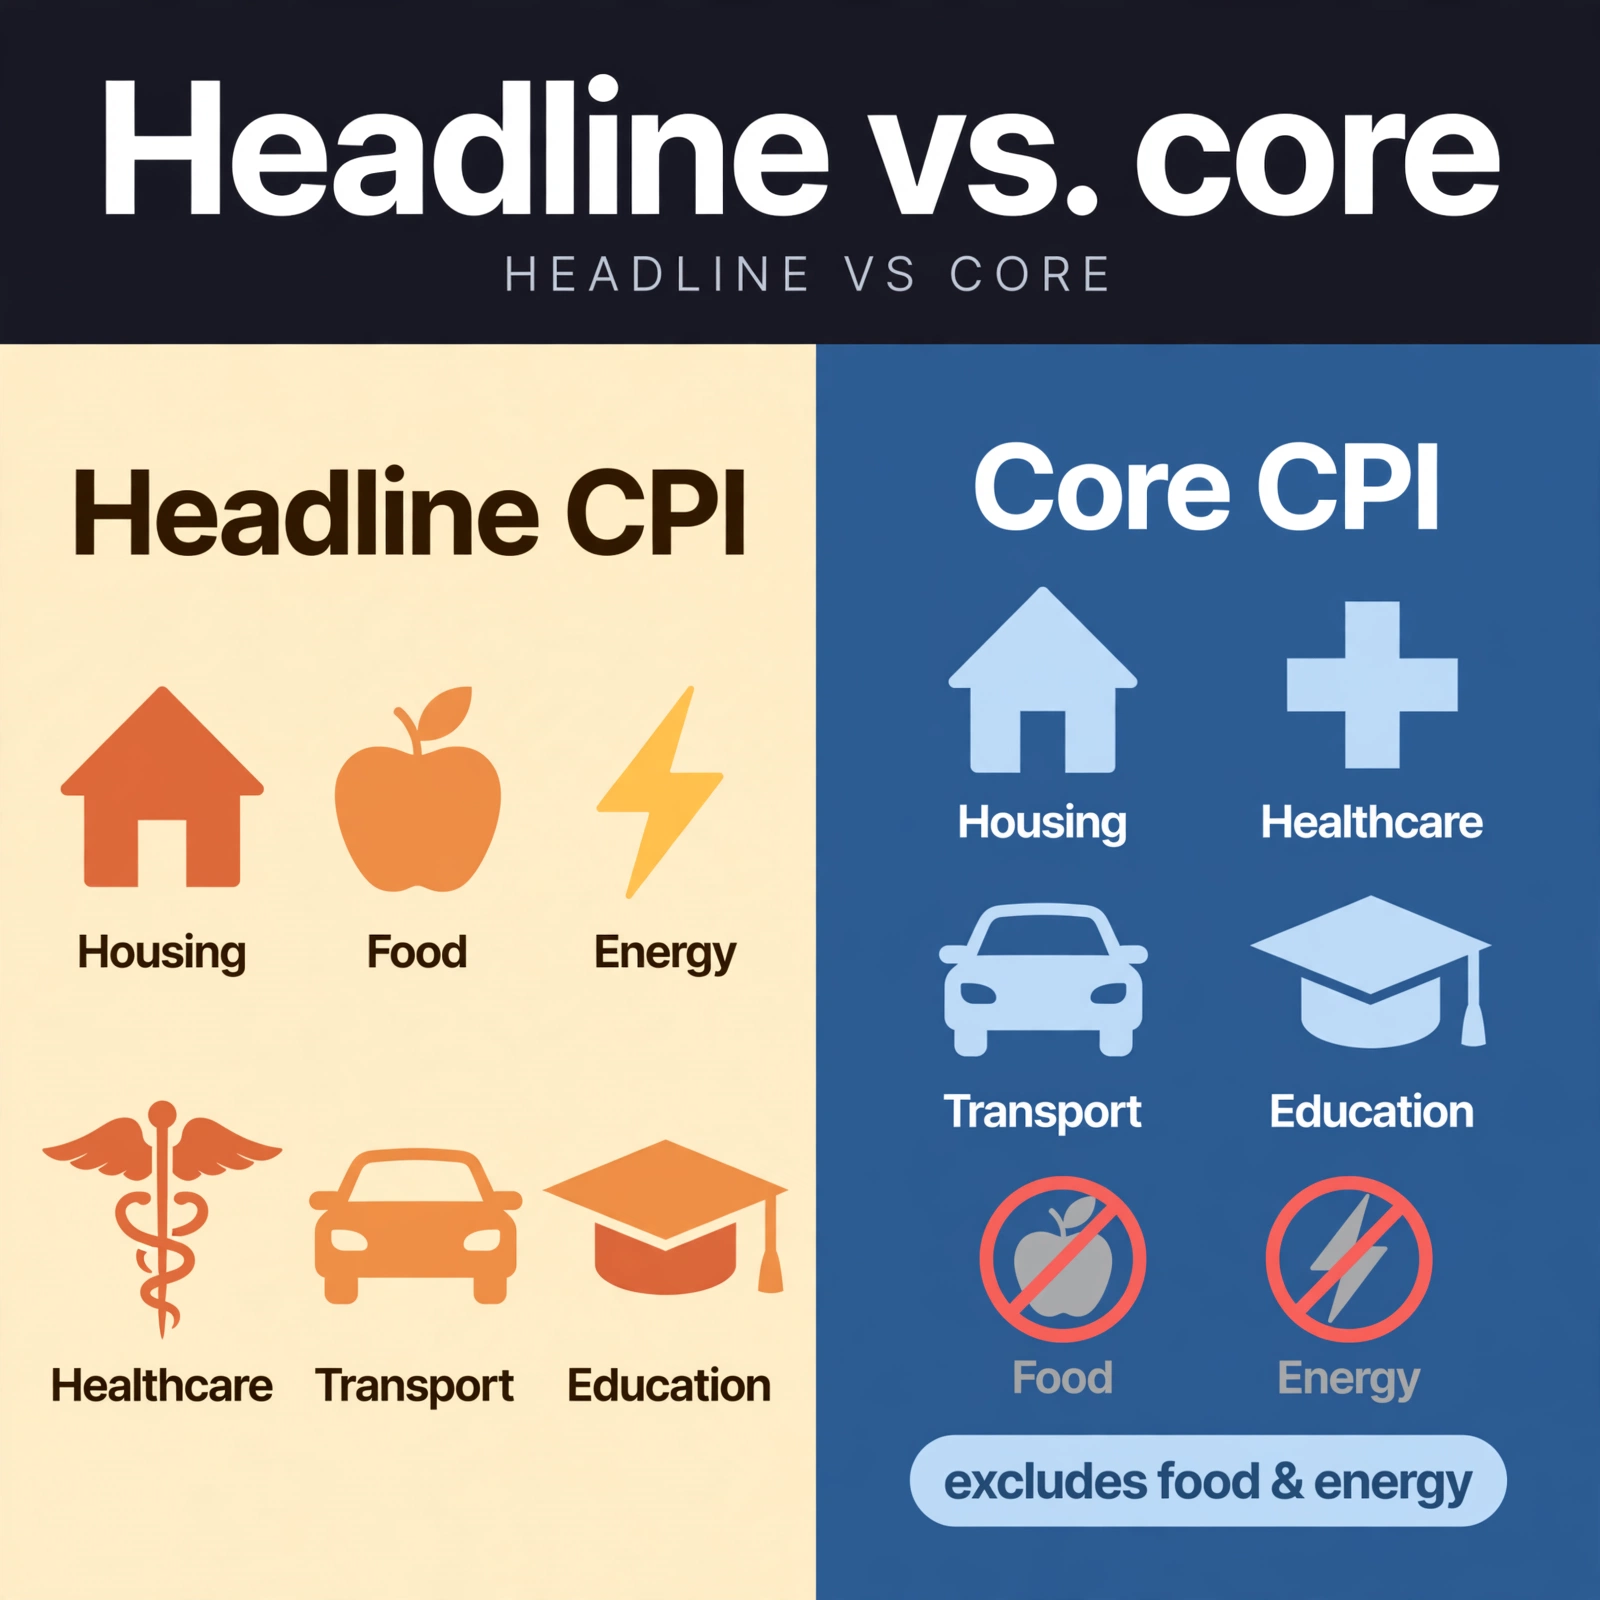
When the news says “CPI,” it means one of two numbers.
| Measure | Coverage | What it shows |
|---|---|---|
| Headline CPI | Full basket | The monthly headline number |
| Core CPI | Excludes food and energy | The underlying inflation trend |
Core CPI strips out food and energy prices. Those swing with oil prices and harvests, hiding inflation’s true direction. For example, an oil spike can lift headline CPI while core stays calm. The Fed’s preferred gauge is actually core PCE, but CPI comes out earlier — so markets treat core CPI as the advance signal for rate expectations.
- BLS: the Bureau of Labor Statistics, the agency that compiles and publishes CPI each month.
- Core CPI: inflation without food and energy. It shows the underlying trend.
- YoY / MoM: year over year / month over month. CPI is usually read YoY (+3.7%).
Why stocks react
When inflation runs hot, markets do this math: hot inflation → higher odds the Fed raises rates → higher borrowing costs for companies and a lower present value of future earnings → falling stock prices. Higher rates also make bonds more attractive, dulling stocks’ relative appeal. Conversely, cool inflation fuels rate-cut hopes and lifts stocks. Growth and tech stocks get hit first, because their value depends most on earnings far in the future.
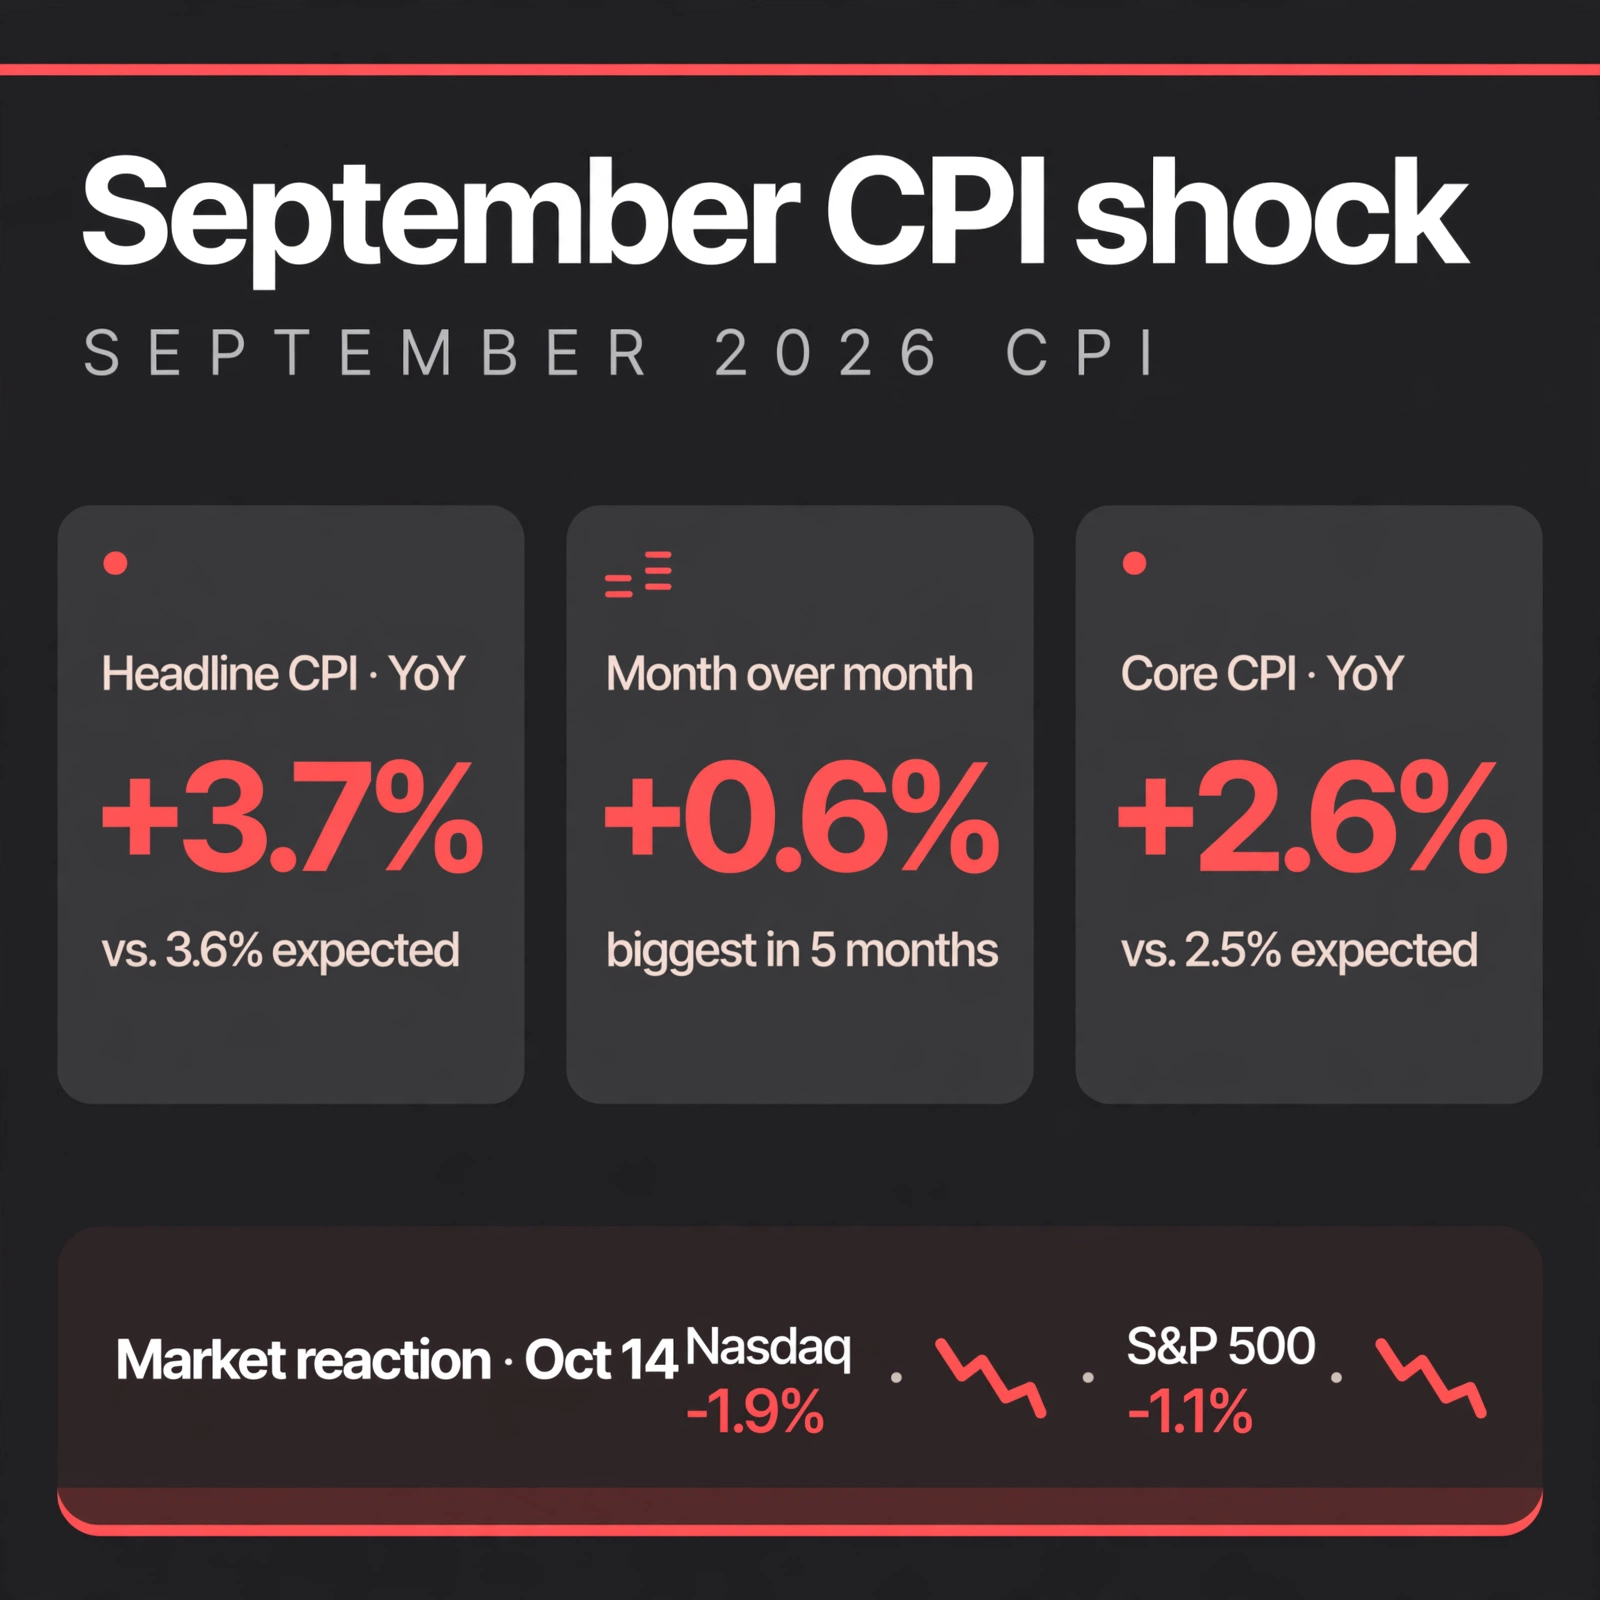
A real example: September 2026 CPI came in at +3.7% year over year, above the expected 3.6%, with +0.6% month over month — the biggest monthly jump in five months. Core CPI was +2.6% versus an expected 2.5%.
The fallout came the same day. On October 14, the Nasdaq fell 1.9% and the S&P 500 dropped 1.1%. October rate-hike odds spiked above 50% intraday.
What investors should watch
Three things to watch when the CPI numbers drop.
- The calendar — the BLS releases the prior month’s reading around the middle of each month. Markets react sharply on release day, so knowing the schedule keeps you calm.
- Core over headline — the Fed’s official yardstick is core PCE, but core CPI comes out first and moves market expectations. If the headline spikes but core stays calm, markets relax. But if core heats up too, rate-hike bets intensify.
- The trend, not one month — the direction over several months matters more than a single surprise. It is the surprise versus expectations that moves markets.
Not investment advice. CPI figures are from U.S. Bureau of Labor Statistics releases.